Feature reduction with Random Forest

Lets say, we have 112 Features for classifying two classes, All the features might not be needed for correlated with class. The procedure which is employed to get rid of less discriminative features is called Feature Reduction.

PCA, ICA and many other techniques are available, Let try doing the same in Random Forest. Let make use of feature ranking that is obtained from random forest.

Procedure:

Divide features into sets of data.

  • In round 1, let’s select 42 features from 112 features.
  • In round 2, let’s select 18 features from 42 features obtained from round 1.
  • In round 3, let’s select 9 features from 18 features obtained from round 2.

Round 1:

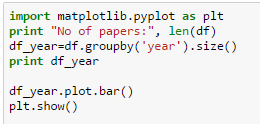
In previous post, we had discussed about, how to split a large data frame into subset dataframe.

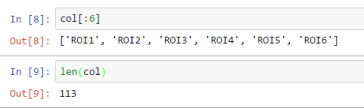
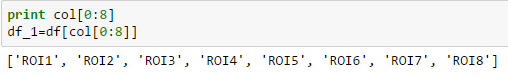
  1. Let’s split dataframe to 14 sub dataframes, with each sub dataframe having 8 features.

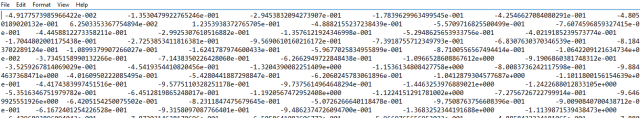
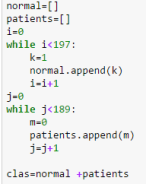
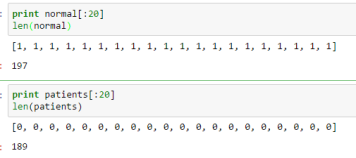
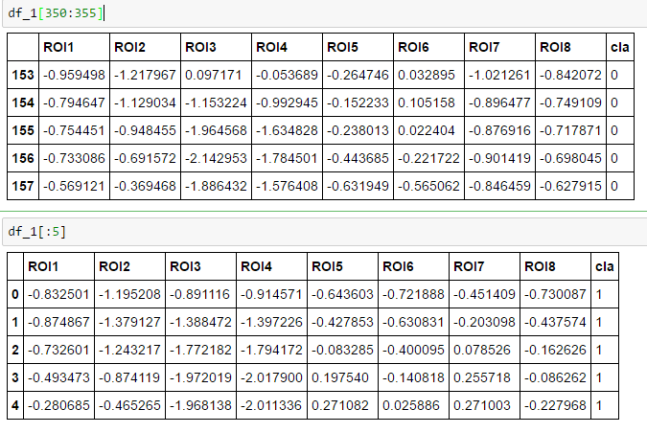
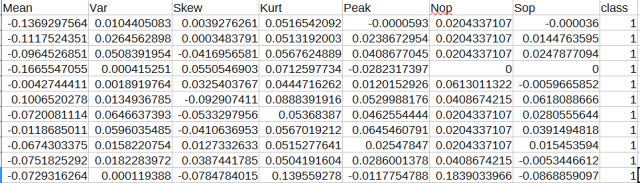
Note: Each sub dataframe has 189 instances (data has:  vertical first half class1, and last half class 0; and last column is class column)

20.png

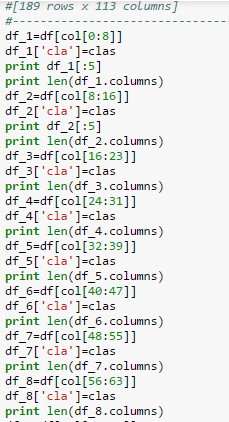
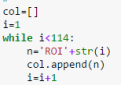
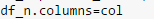
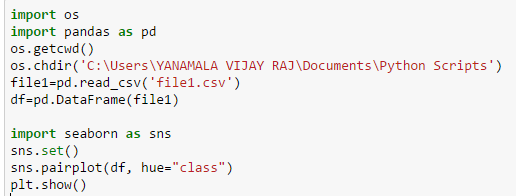
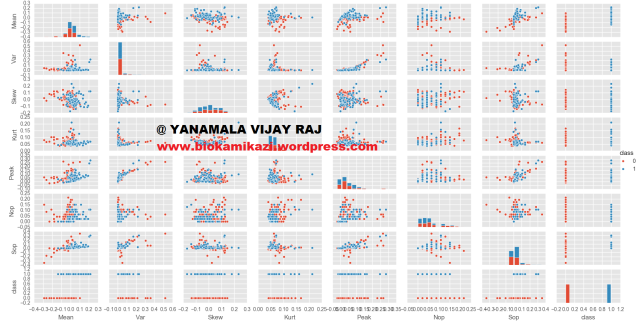
Fig: Code for splitting dataframe into 14 subsets

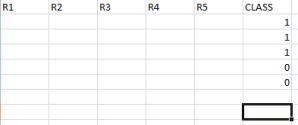
Dataframe splitted into subsets and class column is added to each subset.


Classification done with Random forest, and best features are selected and saved as list.

22.png

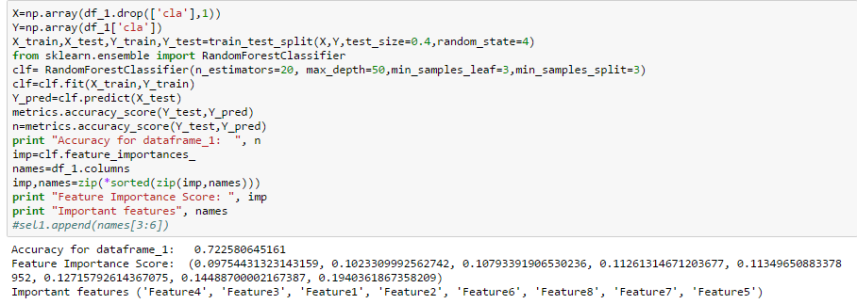
The above code classifies and gives list of important features in list. The last three features are high ranked features and they are selected and appended to list called “sel”. The accuracy of each subset is also appended.


21

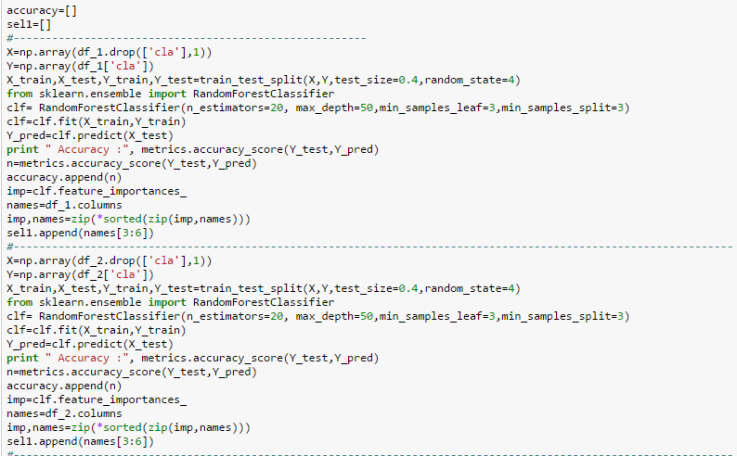
Likewise the classification is done for all 14 datasets, and top three features in each dataset and accuracy of classification is appended in “accuracy” and “sel1” list respectively.

24.png

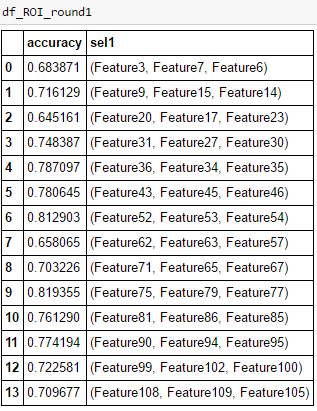
Fig1: Features selected from Round1

Round 2:

The Features displayed in sel1 column can be made a list, and again features can be filtered in the round 2, and round3 to finally get 9 features.

25.png

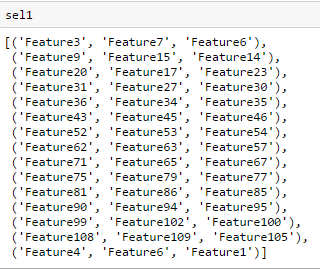
Fig2:Features selected from Round1

27.png

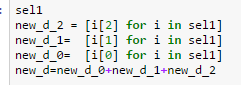
Fig3: Code for obtaining list from list of list.


28.png

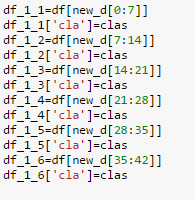
Fig4: Code for splitting dataframe into second subsets for Round2 analysis.

Repeat the same steps for round2, and filter down features from Round2 to Round3.

30

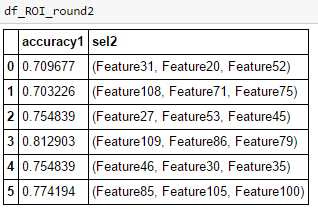
Fig5: Round2 selected Features

31

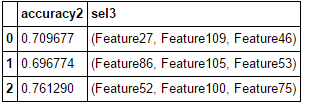
Fig6: Round3 selected Features


By using the features obtained from Round3, and carefully tuning parameters in Random Forest classification accuracy as high as 85% was achieved.


Posted in Programming, Uncategorized | Leave a comment

Awesome pandas library

Pandas is important library in python language for data analytics.

In this post, we will use pandas for our machine learning task, and appreciate the ease with which things get done.

Let say we have data in text data, with no headers

2.png

Fig1: Sample data in text

After Features are identified, and net format that is given as input to classifier looks like this

1.png

Fig2:Format of Input file for classifier

For small input file, manually entering data and feeding it to classifier is easy. When when input data is too huge, one need to consider alternative easy way to do the same task in python way.

Step1: Load file in pandas and concatenate vertically

Vertically half data should be of class1, and rest half data should be of class o,

3.png

11.png

12.png

Step2: Create header

In my case i have ROI1 to ROI 113 as features

Empty list called col is initiated, and for every increment of i, ROI+str(i) is saved or appended in list column.
After loop of 113, new list with 113 instances is created.

4.png

8.png

Header list is created, But how to add it as data frame column name. Here’s how to do it, 🙂

5

Step3: Add class column.

In my case i have 196 class1, 188 class 0.

Similarly empty list normal and patients is created, and list is filled using while loop,

6

9.png

List normal has 197 ones which are class 1, and list patients have 189 zeros which are class 0.

By now, we have added, header to data, if class column is created, then format is ready for classifier.

For concatenating two list horizontally,

10.png

For adding class column to dataframe

13.png

Net dataframe looks like

14.png

Note: To access sections of data frame, pull data with column names

15.png

Likewise huge data frame can be splitted, with respect to column name.

The same work, can be done with matlab too, but with lengthy codes.


Posted in Programming, Uncategorized | Leave a comment

Data Scrap from Google Scholar

Note: This post is only for educational purpose.

In the previous post, we have learned how to scrap data from wikipedia,

Data (table ) can be scrapped likewise from Google scholar too, but there is one problem with the strategy we plan to employ.

Lets scrap data of  Professor Dr Vijay Bhargava from Google scholars in this post,

74

When we scrap table with table class tag or id tag only data that is non-hidden from total data in table is scrapped.

  • Table id: gsc_a_tr
  • td class: gsc_a_t (paper name, year published, no of citations)
  • div class:  gs_gray ( author data)

Untitled

Fig1: Table data (rest of data is hidden, and unlocked by clicking on “show more button”

Untitled1

Fig2: unlocked dynamically hidden data

Hence it is planned to use selenium library to unlock dynamically hidden data by clicking on “Show more” Button required no of times.

57.png

Fig3: Show more click button

Untitled3

Fig4: selenium library code to unlock dynamically hidden data

Untitled4

Fig5: Beautiful soup to grab data from table (full data that included hidden dynamic data)

Untitled5

Fig6: div class gs_gray has author name data for each paper

Scrapped data from web, appended to dataframe

Untitled6

Fig7: Appended dataframe

Untitled7

Fig8: Group data by year ( that gives no of papers published per year)

Untitled8

Fig9: Grouped data by year, no of papers

Untitled9

Fig10: Bar graph that represents no of papers on y axis, and year of publication on x axis.


Posted in Programming | Leave a comment

Scrap table from wiki

Scarpping table from wiki and saving it to .csv with python is damn easy, Its just matter of ten line code,

Lets scrap table from two pages,

page1: https://en.wikipedia.org/wiki/Oncogene

page2: https://en.wikipedia.org/wiki/List_of_gene_prediction_software

1.png

Fig1: Table from page1

2.png

Fig2: Code for scrapping table from page1

3

Fig3: Dataframe created from scrapping data from page1

4.png

Fig4: Dataframe saved to csv file

Similarly table from page2 can be scrapped,

5.png

Fig5: Dataframe created from scrapping data from page1

6.png

Fig6: Dataframe saved to csv file

Posted in Programming, Uncategorized | Tagged , , | Leave a comment

Segmented brodmann area(22,44,45) ROI

In fMRI (functional magnetic resonance imaging ) studies, BA ROIs are important to cross-check activation area in brain.

BA rois can be downloaded from marsbar website ( http://marsbar.sourceforge.net/)

=> But there is one problem with the ROI’s that’s offered. For example consider BA 44,45 (broca region) roi.

8

Fig1: BA 44&45

=> The roi is for both right and left lobe. But if BA roi can be splitted into left and right roi, it would be more useful for studying lateralization aspects of brain.

=> This problem can be solved by creating box roi with dimensions that overlap BA 44&45.

=> Split standard BA roi’s can be created using “AND” function of marsbar

More about reforming ROI can be learned at http://marsbar.sourceforge.net/tutorial/define.html#refining-the-roi

=> Net splitted BA rois into BA_44&45_L and  BA_44&45_R

=> Likewise splitted BA rios of BA_22_L and BA_22_R can also be done


Download (BA_44&45_L, BA_44&45_R,BA_22_L,BA_22_R) :   https://drive.google.com/folderview?id=0B1ZGConSePAcRERBSmlSVHJ4dU0&usp=sharing

Posted in fMRI | Tagged , , , | Leave a comment

Custom made dictionary with Python

In this post, lets learn about custom made dictionary with python

Requirements: BeautifulSoup, urllib2 library

Vocabulary.com is excellent site, for improving vocabulary. But instead of browsing, if there is a way to grab  required data, for a set of words, it is possible to make dictionary for our-self.

1.png

Fig1: Vocabulary.com

=> Each word has a short meaning and long meaning. Let click on the short meaning arena, thats just below the word.

2.png

=> Identify the class with which it is identified. Class with which short meaning is tagged with is “short”. Like wise identify class tag associated with long meaning.

3.png

=> Create text file, with required words,

4

=> Here is the code, run it

5.png

=> Output (custom made dictionary)

6.png

Note: This post is for only educational purpose. 

Likewise data can be grabbed for a set of queries at a time, with simple codes in python.


Posted in Programming, Uncategorized | Tagged | Leave a comment

Scatter plot in Python

Scatter plot is helpful is choosing important feature for predicting class in machine learning.

Scatter plot can be plotted easily with few line code with sea-born library

  1. Data set

22.png

2. Code

54.png

3. Scatter plot

figure_1-1.png


Posted in Machine Learning | Leave a comment

Download YouTube videos in Python

Downloading videos from youtube is easier with python

Requirements: Python, youtube_dl library

Here’s the code,save it as .py and run it.

11.png

Enter URL, with in ” __ ”

78

Enter, and get link to download video

789.png

Posted in Programming, Uncategorized | Tagged | Leave a comment

Automate browsing for stock values with Python

Lets automate browsing for stock values from yahoo finance

Requirements: Python, urllib2 library,

1)The Yahoo finance stock value of apple

10.png

2) URL, hints that searching various stock values in yahoo finance website can be automated.

URL of apple stock: http://finance.yahoo.com/q?s=AAPL
URL of google stock: http://finance.yahoo.com/q?s=GOOGL

Therefore url search can be automated by changing code (AAPL, GOOGL) to a string that has list of company code.

3) Now in web-designing, each value or each text displayed in website has an unique id and code. If that can be fished out, and given to python to fish out stock value with respect to URL, automation of searching website and getting list of various company stock values is possible.

2.png

4) Armed with unique id of stock value, and unique URL id, lets write a program that give list of stock values. Get company list from NASDAQ website

3.png

and save only the company codes in the downloaded excel file, to a text file and move it to working directory.

5.png

5) Back-end work is done, and only coding is left

Here is the code

6.png

We wrote a code for generating list of first 5o companies stock values,

Like wise, to get list of all companies change

code as

i=0

while i <len(newstocklist)

6)  list of 5o companies stock values

7.png


Like wise, Google stock, weather list, can be automated.


Posted in Programming | Tagged , | Leave a comment

Getting List of pdfs in a folder with Python

Sometimes, in research, one might rename pdf name as per their comfort, and when trying to review bulky amount of pdfs, it becomes difficult to identify the pdf, copy the name of pdf, copy multiple file names together,

Here is a short code which should make things easy

  1. Suppose i have tons of file in googledrive, I need to get a list of pdf i have, to share with my friend or prof. I might also need to copy all the file names together. Traditionally i should have to go and copy each and every file name individually and paste it on note/word and save it.
  2. With python things get easy.

9

3. Run this code and you get list of pdfs you have in directed folder

10


Posted in Programming, Uncategorized | Tagged , , | Leave a comment